
I do these live drawings while people are speaking in order to demonstrate their ideas. Orginally mentored by James Carlson, I started doing visual thinking in earnest when someone turned left in front of me, causing a shattered radius. Since, it’s become my primary method of note taking, and a wonderful way to augment written notes.
Different Things to Show
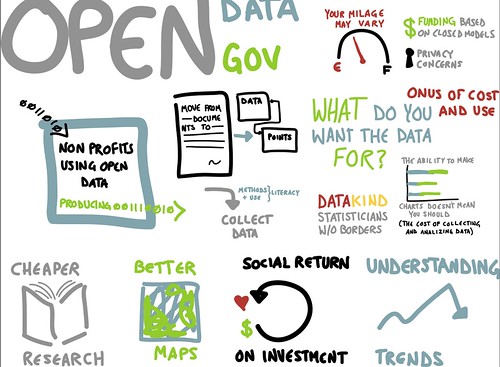
Charts!At its most basic, visual thinking is a way to show workflow and charts. Rather than explaining in lengthy and complicating words, a drawing can often demonstrate relationships and interactions between components. Charts can be serious and examinging:
Or they can be silly and humorous:

Individual IdeasOften, when people are speaking or beginning to flesh out an idea, it makes sense to draw the individual components or speaking points as just that – individual parts. Using Adobe Ideas on my iPad, I do one layer per point. Often, these just end up as a collection of strangely-shaped references to ideas, which can then be arranged (remember, different layers!) to look nice nested within each other. This is, I suppose, a form of graphic design.
If there are enough components, or enough detail, it’s worth embedding into a prezi and defining a path for the viewer. More on that later. And http://prezi.com/d6ciafhoptrq/intertwinkles/De Conflating IdeasIt also helps to de-complicate what is a part of a workflow, what isn’t, and where confusion is coming in. This is the part of the conversation or explanation where we start gesticulating or arranging things on the table to demonstrate a point. For instance, I was frustrated that a bunch of digital disaster response groups wanted to list all the other projects that were going on for a certain topic (in this case, Hurricane Sandy). This is bulky because then there are many places to update if a project changes, completes, or dies. After spending 40+ lines of text in chat trying to explain what I meant, drawing this picture helped much more.
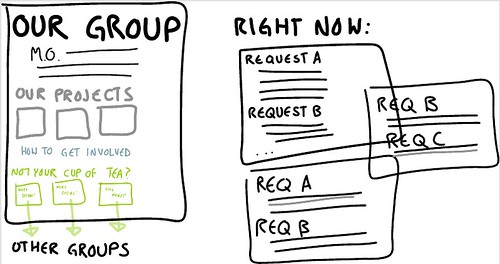
One reason the internet is amazing is because of the ability to point sections of a webpage at other webpages (RSS FTW). Not doing that was over complicating matters, but so what trying to differentiate via text rather than in a drawing.
Building a Story
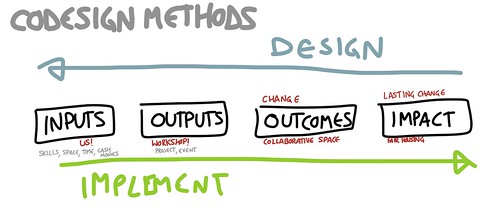
Now that you’re able to deconflate ideas as well as delineate them, it makes sense to move on to how components of a story interact with each other. Rather than moving from node to node, this method takes layers in Adobe Ideas and stacks them on top of one another. In this way, you can start to see how ideas flow into each other, and how they interact.
http://prezi.com/zi19tv4lwypr/the-psychology-of-difference-and-the-science-of-difference/
System Interaction
Life isn’t linear, and at times it is difficult to express all the moving parts while not losing the trees for the forest. While all models are incomplete (but they can still be useful), having a drawing can acknowledge the boundaries of a systems model while not dwelling on those limitations.
http://prezi.com/0tky5lswrnbn/fema-field-innovation-team/
Similar to storytelling and individual nodes, we still see the individual components. However, in a System Interaction drawing, we see how those components play off of each other, and see where leverage points might be.
Tools
Stylus
I use an iPad and an electrostatic sock over a chopstick from this dude:
http://www.etsy.com/search?q=shapedad&view_type=gallery&ship_to=US
Sometimes I pick up a stylus from a store.
Adobe Ideas
Is what I draw in. It provides many useful components while not being so overwhelming as to be ungainly, nor difficult for new users.
Graphics are vector, though the canvas isn’t quite infinite. It exports as PDF, which can be surprisingly versatile once you get ahold of them. And, it imports nicely into Prezi. It’s also available on Android, but a bit laggy.
Notability
For general note-taking, and text-heavy talks, Notability is also pretty great. It’s what I use for some IEEE Global Humanitarian Technology Conference notes, because it nests drawings in with text in with images all in the same document. It’s not useful for the Prezi-zoom interface, but it’s much better for in-depth blog entries.
It also does this great thing where it will record audio and sync your notes to it. Personally super useful, especially as you become reliant upon including drawings in some way.
Prezi
Prezi is what a lot of this work goes into. It lets me guide the way people move through notes – nested ideas, eastereggs, and all. That is probably a tutorial in and of itself, but here is something about how my brain works around it: http://blog.prezi.com/latest/2013/10/4/how-a-broken-arm-and-prezi-helped-me-save-new-york.html