
Originally published on the Aspiration blog
We have been working on a map of the digital response ecosystem here at Aspiration. While we still have a ways to go, I wanted to pause to reflect on why we are working on it and some things I have learned along the way. If you’re so inclined, the closing section includes a request for feedback and a way to be in touch.
The current state of affairs
Disaster and humanitarian response happen in a chaotic and low-information environment. Even if historical context, accurate maps, and up-to-date data existed before a shock, an extreme event will have disrupted that baseline in dramatic ways. Response organizations deploy into these environments seeking what we call “situational awareness,” sometimes wondering about who to ask about the location of vulnerable persons, other times wanting to know which roads are still navigable. In order to know more about their physical and logistical environment, many response organizations and community groups are beginning to make use of digital tools. There are also digital tools which allow us to do truly new things in addition to information gaining and sharing. Digital tools might be in the form of crowd-sourced maps about needs and outages made from Twitter updates with hashtags, or images composited from a drone for an overview of an affected region for locating the most damaged areas, or heavy statistical modeling based on datasets from multiple sources for more precise resource distribution. The introduction of these new people, processes, and tools for digital response can increase the chaos of response or alleviate it.
Official and specialized actors such as United Nations Office of Coordinated Humanitarian Affairs (UNOCHA) and the International Federation of Red Cross and Red Crescent Societies (IFRC) stand to benefit from the new skills of digital tools and the processes they enable when they are able to fold these new tools into their existing structures. When they are able to do this, we all benefit from their increased capacity. Frontline populations in affected regions continue to use digital tools like Signal and Facebook to organize themselves and coordinate response. Community groups such as churches and schools are using their existing digital community infrastructure to organize larger local relief efforts. Digital responders help to clean, structure, and utilize the massive amounts of information generated in times of crisis so those in the midst of the chaos can have more visibility to the requests, offers, and other factors in play around them.
Is there any signal in this noise?
What does this flurry of activity look like, and how can it be improved? How can we someday make crisis response boring? What are the patterns in who does what, when, and how do they coordinate with each other? While some official organizations have name-brand recognition, there is little understanding of local, emerging, and digital sectors. Their contributions and challenges are often rolled up into the official response organizations’ documentation, if it is documented at all. The flows of information, communication, and other aspects of coordination are poorly understood, even by those within the ecosystem, and especially in regards to the smaller and newer groups. Is it feasible to have a roster of all local groups with capacity related to response? Who would build it and keep it up to date? Would we trust the data it contained? It is this complexity which is partly to blame for official response organizations not being able to have situational awareness and to relatedly struggle to meet local needs. So when an extreme event happens, groups spin up locally and remotely because of pressing need and the invisibility or inadequacy of pre-existing response groups. Those new groups persist, morph, merge, or dissolve through response and recovery phases of the disaster cycle. It used to be standard for several hundred response groups (pre-existing or otherwise) to respond to a crisis. Four thousand responded to the Haitian earthquake. The desire to involve technology in this mix has increased the number of factors to consider by adding in tools, active remote and local people, and even new abilities. Most people also point at the 2010 earthquake in Haiti as the first instance of digital tools making a discernible impact in crisis response. While this is a moment of potentially increased chaos in a space sorely needing alignment and sharing, it is also a moment of potential. What if we bring our ideals of openness and co-equality to the table? What if we trust the network (frontline community members, official responders, volunteers, remote assistance, etc.) to understand and sort itself out, adapting to challenges as they emerge?
Making the invisible visible
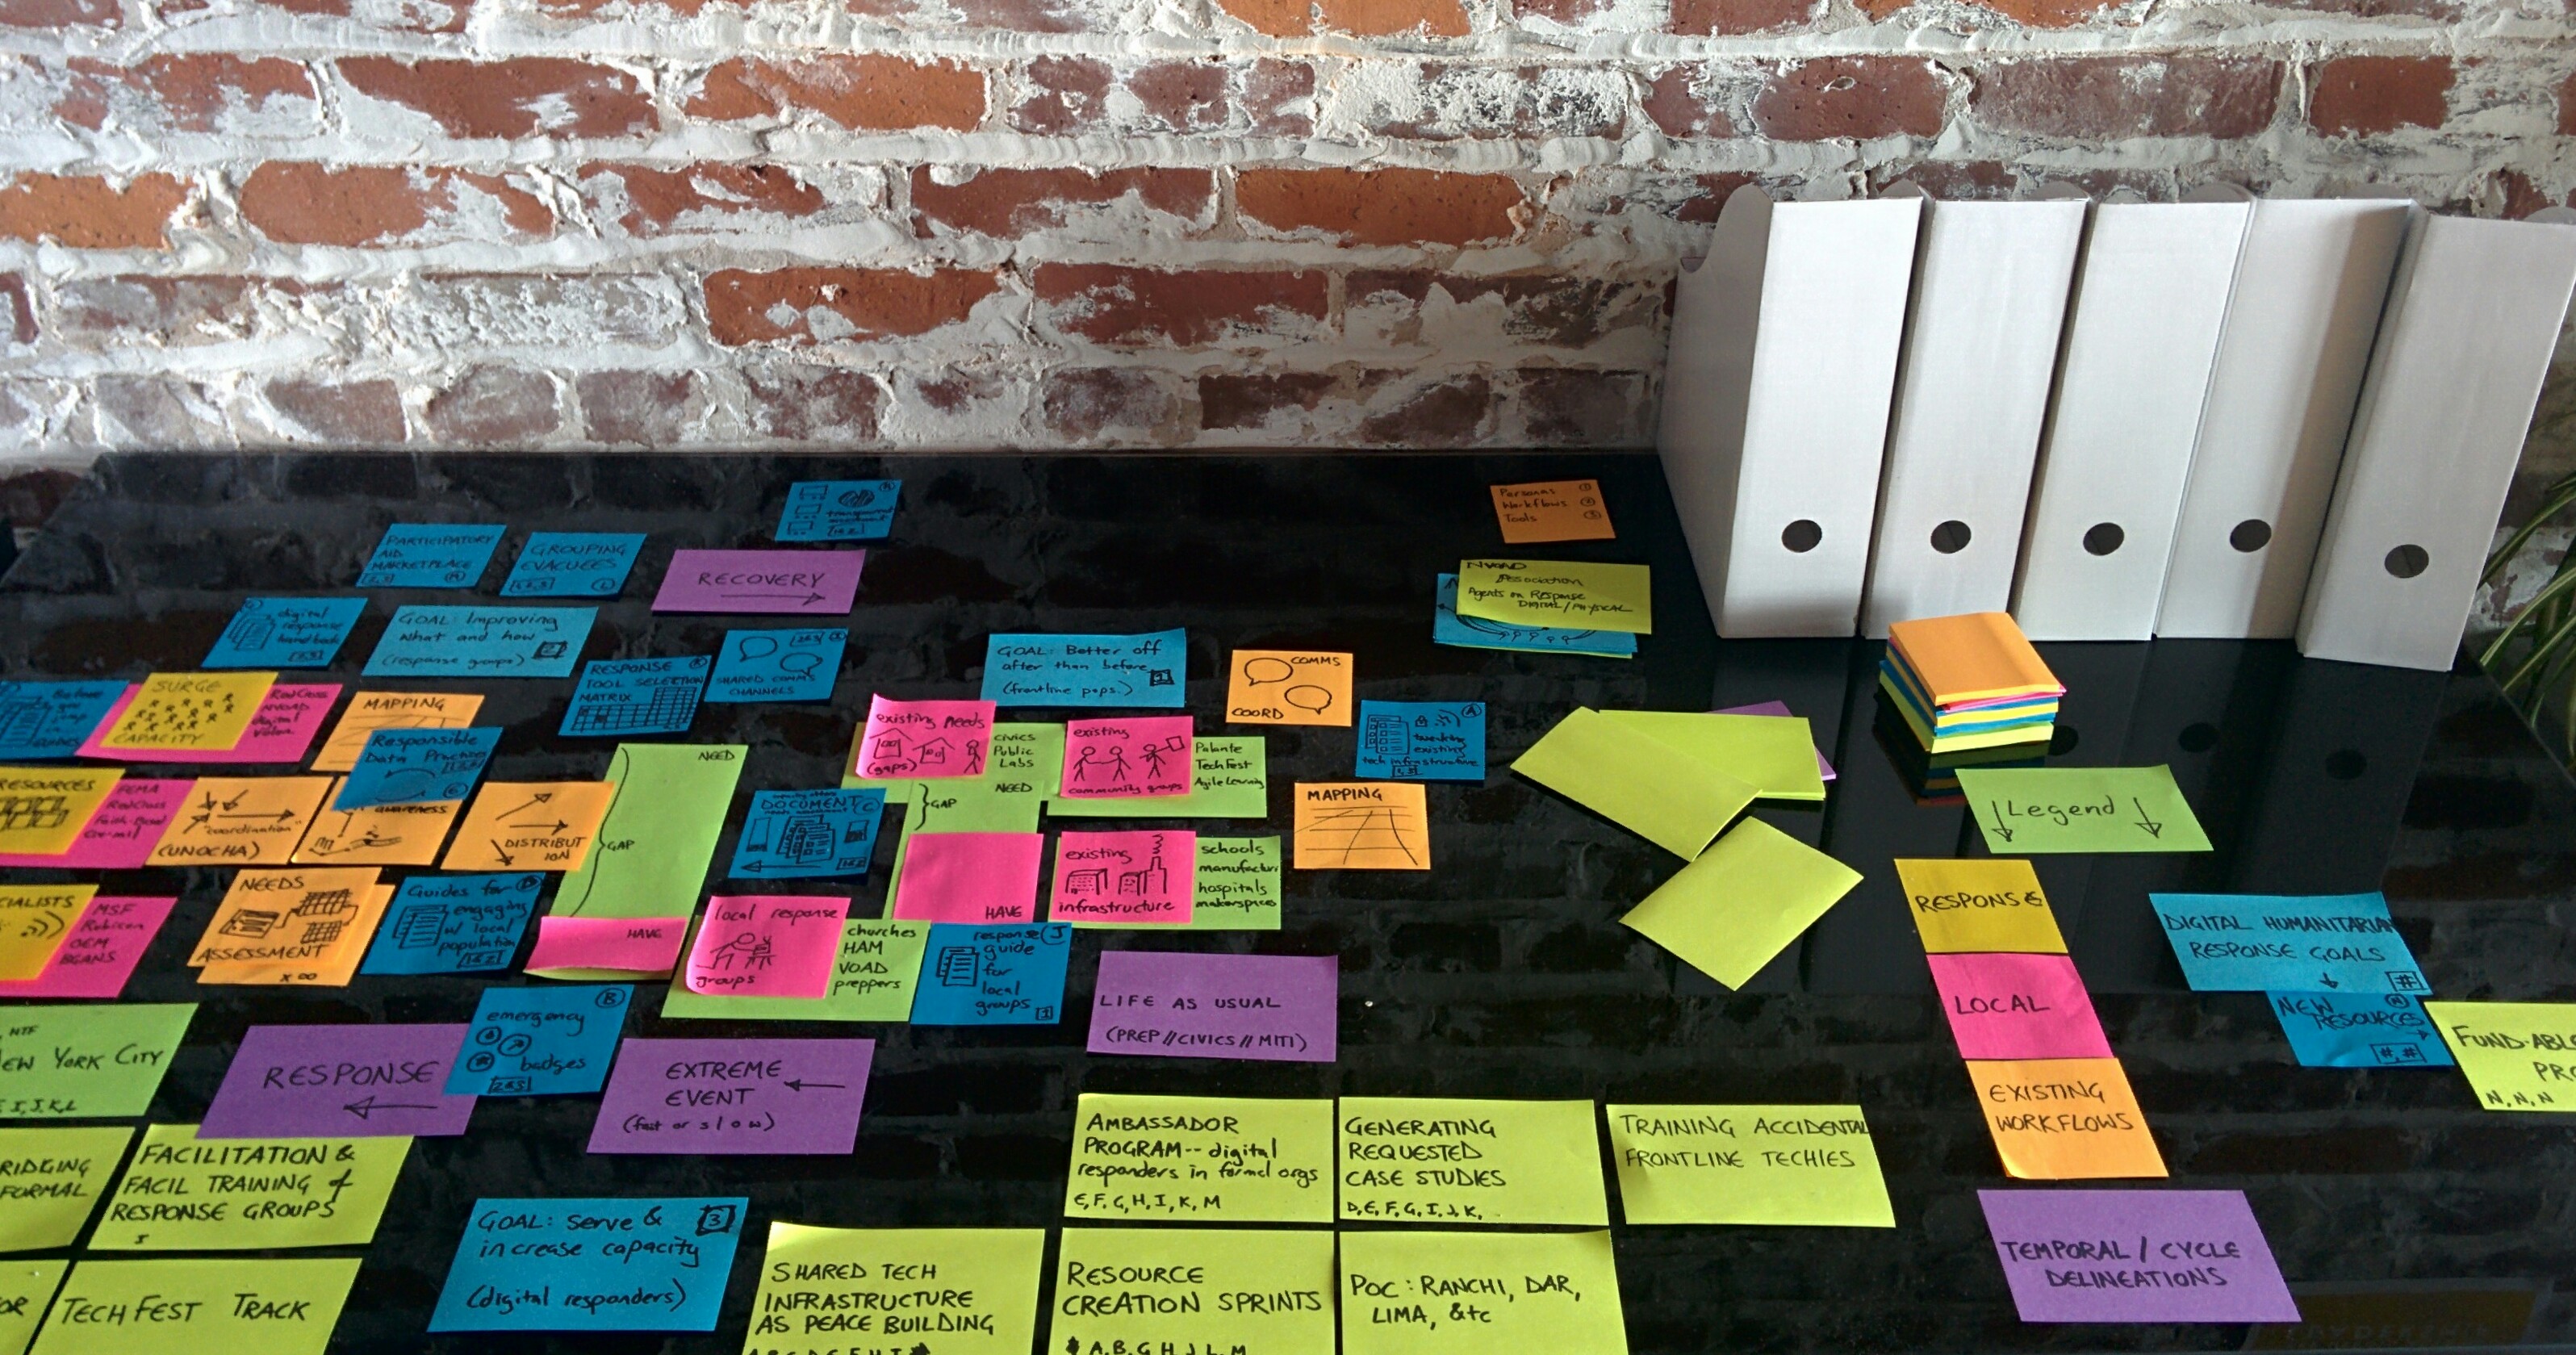
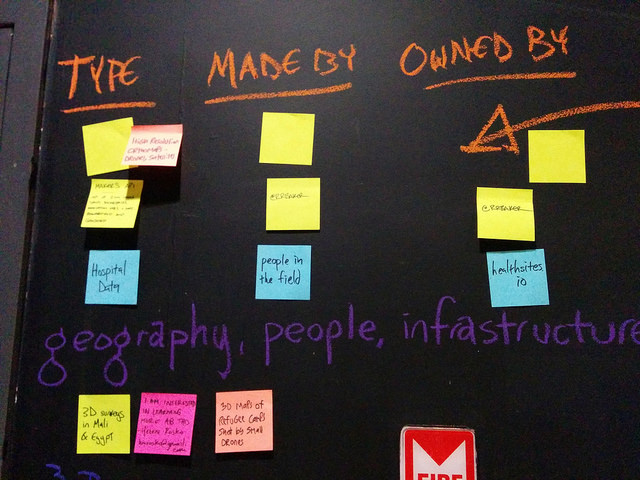
With acknowledgement that the digital response ecosystem is a living and changing thing, a map of it could provide a shared view of current actors, the tools they use, the data generated and used by those tools, and the resources we build from and contribute back to. Our hope is that this shared view might help us to provide better ground for refining information flow, to discover possibilities for collaboration, and to devise shared infrastructure. We could thus begin to think more holistically about response, get insights into how to make response infrastructure and mechanisms more sustainable and scalable, and be able to easily share an overview to newcomers or other interested parties. It is with these hopes that we started asking for help in building a map of the digital response ecosystem. Through calls with allies and structured activities at Humanitarian Technology Festival, HumTech, the Doctors Without Borders Logistics Day, and at the June 2016 Digital Responders’ Meetup, the map is slowly beginning to take shape. Here are some things we have learned along the way.
This is a volatile space
Crisis response is by its very nature generally unpredictable. A rare caveat are hurricanes, as our weather science is getting better and better so we can approximate their strength and direction. But because we still do not understand what is going on with the earth’s crust and seas, earthquakes are still widely considered impossible to predict. Droughts are often just as political as they are about complex environmental factors, so anticipating them is somewhere in between. This means it is difficult to get any sense of predictability to rely upon or plan within for crisis response. Our data model needed to factor in the components which trigger a response group deploying or emerging from a frontline community. Activation could be based on geography (local, regional, national, international), based on the part of the disaster cycle, or based on an explicit request (from an international agency, national or local government, or a community group). Some groups (like Doctors Without Borders) are not activated from external cues per se, but instead based on their own mandates. And each of these groups focuses on different topics, ranging from accountability to mapping to data sharing to telecommunications infrastructure. To try to show connections and flows between these different entities which also bridge geography and time cycles can be somewhat daunting! Too much granularity and the whole thing is overwhelming, but too little and no patterns can be picked out.
Our sharing gaps are significant
Open (and responsible) data, libre source code, and collaboration are heavily advocated for in humanitarian and disaster response. We often hope to work miracles on shoestring budgets and with little awareness of what our comrades are up to. With a few shining examples such as Kathmandu Living Labs in the 2015 Nepal earthquake and Crisis Cleanup for Sandy, efforts to share our knowledge and intentions with each other are more often stymied than not. It is a common story that the country office of one international response nongovernmental organization does not know how (or even what) the office in another country is doing. This means it is even less likely their partner organizations or other groups in the same deployment know what they are up to. During a crisis, sharing and communication occur by force of function, but also in hugely inefficient ways because other priorities are at hand. UNOCHA has done a lot of work in this space, making it easy for deploying groups to upload and view data in a shared space through the Humanitarian Data Exchange and the Humanitarian Exchange Language, along with their traditional Cluster Approach. However, much of this work is targeted at established and dedicated response groups who know how to look for each other and have potential funding infrastructure which requires their collaboration. The smaller, ad hoc, and digital response groups do not have the context or infrastructure for their sharing and collaboration amongst themselves nor with larger response groups. There is still a lot of work to be done in sharing data and plans within and between organizations, across different parts of the response cycle, as well as with local community groups.
Who will (and can) show up changes
Because there are so many factors in who can deploy where, when, and why, investing the time in building relationships and channels for communication and sharing could be seen as a waste. It is even more impossible to have a plan that will be of any use in this circumstance than in nearly any other, and to rely heavily on rigid plans rather than adaptability is a recipe for disaster. But planning is still necessary if we are ever going to get better at response than we are now. Rather than rigid plans and expectations, we can instead focus more on the sorts of response groups that show up, the types of local groups which emerge, and the patterns of their interaction. Resources for these categories and personas have to be generalizable enough to be used, improved, and updated by anyone in that category or of that persona. Mapping the ecosystem is not just about having an easy-to-approach description of the space, but also about discovering the most strategic communally-held resources to create (or to find and share).
Where to from here?
We are moving towards a stable draft of the ecosystem map, and we want your feedback! You can attend the August Digital Responders’ meetup, join the mailing list, or just ping us directly.
We would like to thank all the folks who have already spent so much time and energy on this concept with us. I have especially benefited from conversations with Devin Balkind, as well as referencing past collaborations he had a huge hand in, namely Aid Badges and Resilience Colab. Heather Leson has been a huge contributor and supporter. The attendees of Humanitarian Technology Festival, the hallway conversations at HumTech, the participants of the Doctors Without Borders Logistics and Clinician Day, and cohorts at the June Digital Responders’ Meetup have also added a great deal of information and structure to this data. Because we are doing this together, it can grow beyond a proprietary or bottlenecked resource into one useful for the entirety of the space.