Originally posted on the Aspiration blog
I was in Nairobi, Kenya, at the end of April participating in various happenings across humanitarian response spaces. From interactive gameplay to resiliency indicators, here’s how we focused attention on frontline communities through digital means.
Facilitating gameplay to model for resource allocation
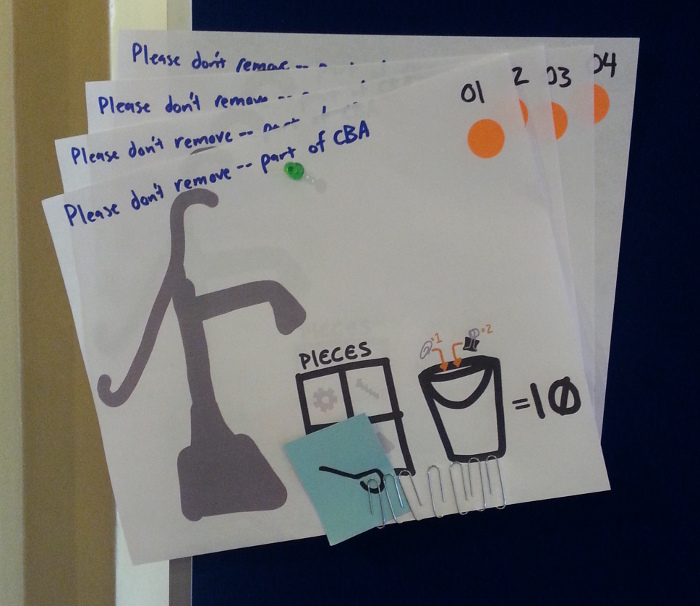
I attended the 9th International Conference on Community-Based Adaptation (CBA9) with the Red Cross/Red Crescent Climate Centre in Nairobi on April 24-30. I was there to facilitate a game which simulated the citizen reporting of water resource status and distribution in an area to better inform allocation.
The game stems from Taarifa, a free software project that has been widely deployed to collect, visualize, and map infrastructure information. The Climate Centre is well known (and appreciated) for their distillations of complex climate, environmental, and social systems into fun-to-play games, which are available on their website.
Often, these games start simply, and then complexity is layered on as each set of rules is understood by the participants. There are additional challenges when designing a “pervasive game” like this one, which is a game that extends play out into the wider physical world. All the details needed to be written on one piece of paper and accessible across languages, and players need to be able to join at any point, and without a facilitation start-session. Phew. We did our best, and you can view our materials here.
Day one was focused on re-creating the system as it is now – everyone had to find the rest of their community, their malfunctioning water points, and engineers. Some would know the problems in space and time, but others had the tools to solve them when and where needed. How to link problem and solution? Communication was intermittent, if it happened at all. Information sharing was consistently one step behind of the facts.
On day two, we introduced the ability to SMS update and query, thus enabling a faster and more efficient match between broken pumps and the engineers who could bring tools and parts to help communities have safe water. People now only needed to find each other to make exchanges, and they were able to document and share in real time where water points were and what the status was.
How’d it go? It was confusing… just like life. There was slow uptake… just like life. Only one group used the technical assist (i.e., SMS)… just like life.
This game showed what we think we already know— that having a solid technical tool doesn’t mean anyone is going to use it. But as community-based adaptation practitioners, we often need to (re)learn what we kind-of know, and ask some tough questions, such as ‘why are available solutions not being fully embraced by those who can allegedly benefit from them?’
In Tanzania, the Taarifa team had a chance to both chat with end users about what their hopes and concerns were, as well as work with local software developers to localize the interface. That activity alone increases buy-in, as well as increasing appropriateness.
This game created a space for conference participants to see the same lack of uptake in their own behavior that pervades climate and development work, rather than it being an externalized problem space to grapple with during program design and implementation. It highlighted our collective need to better tap into the social systems around digital solutions, and rethink how to enable genuine embracing by those who can benefit from them. The Climate Centre will be taking the game forward into Zambia, where climate change and infrastructure are already under intense scrutiny.
Supporting community-driven indicators of resiliency
We are taking part in an initiative to build locally-driven strategies for resilience to extreme events such as drought. Our focus within the “Global Resilience Challenge” is on local indicators, or measurements, of resilience.
“You get what you measure,” as systems thinker Donella Meadows once said. When we talk about indicators of resilience, things like gross domestic products, income, and education come to mind. But that doesn’t work for everyone in all places. Actually, we often find that “more” (higher GDP, more trade, etc) is a dangerous synonym to describe “better” when we are trying to evaluate resiliencey.
In response, a few groups have worked on measuring other things, such as the happiness index. Similarly, what matters in resilience is that frontline communities are the ones describing what their own environments look like, what is important to pay attention to, and laying boundaries in how to interact. If communities have the ability to determine their own indicators and carry out subjective measurements within open data frameworks, large-scale understanding can also happen across communities.
What do we even mean by subjective? My favorite “subjectivity” delineation occurs around “framed” and “open-ended.” For example, we could set out a frame of the top five things we think are related to resilience, and then ask community members en masse how they rate their own standing on those things. Or we can ask people what they think is important to their own resilience. Both are subjective indicators.
To make this project happen, we are collaborating with the Overseas Development Institute, National Drought Management Agency (Kenya), GeoPoll, DataPop (Harvard Humanitarian Initiative and MIT Media Lab), CGIAR Research Program on Climate Change, Agriculture and Food Security, and the Center for Civic Media. We’re reading a lot, talking to community partners, and beginning to ramp up various ways of both examining what questions we should be asking as well as how we’ll ask (SMS surveys, household surveys, call centers, other). We’ll try some of these things out and meet again in June or July.

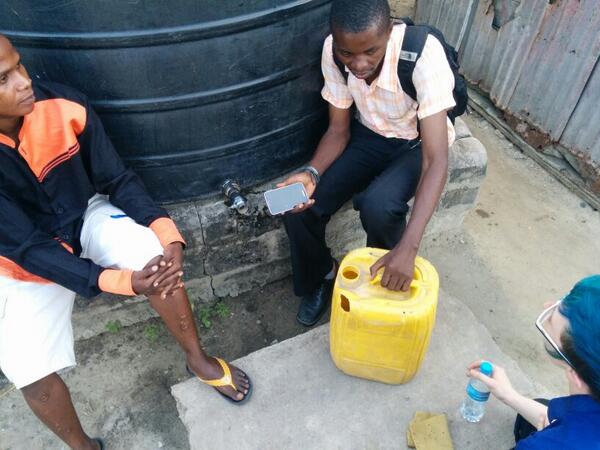 I ask questions. How do people know that one is broken? I wonder about where knowledge of what is going on would be hosted and shared. Is there a town center where things are posted, or is it all word of mouth? No center, just neighbors telling neighbors. No bulletin board system. I saw a vanishingly small number of feature phones while we were out. Only government and donor officials and contractors smart phones. Which, to me, makes me wonder how to get maps built of the water system back to the people in the area
 Now, these things are tiny, just big enough for two people plus some wiggle room. Here we have 3 of us, of whom one is over 6’6”. In the strange layering of apologizing, stubbornness (from all parties), and negotiation of money, we make our way back into town to have dinner and pile through emails. We walk home (hooray!), Mark stating time and time again “not a tourist” in Swahili. We get freshened up and head out to see a friend. As it’s rush hour, we pile onto a bodaboda, or a motorcycle taxi. Both of us. Making three people. We ride like this for awhile, Mark asking passing motos if they are also bodabodas, offloading onto an available one, us easing between lanes of traffic and narrowly avoiding potholes. Sometimes we ride on the sidewalk. When we arrive, we drink beer on a balcony, talking about teaching coding and entrepreneurship, discovering what patterns work across places and what must be thrown out. I find a difficult conflict in myself, between a growing awareness of levels of corruption, and my deep need to defer to people who live the reality of this place. I think back to conversations I had with Lorraine over lunch at Theorizing the Web, about how people are able to use any system to still do good, and you disrupt them as well when you shift systems. And then a car ride to dinner with assessors of programs. Amazing Indian food, and conversations around baselines and statistically predictable incongruities, and how to learn from things even as you fail from them. And beer in a place called Cuba, which we joked I couldn’t get into. And then finally back to the hotel to sleep.